
Funnel Analytics Dashboard Overview
Published: Updated:
The Funnel Analytics Dashboard provides a detailed view of how users move through your funnels. It tracks key metrics such as views, opt-ins, sales, recurring sales, and conversion rates, helping you understand which steps perform well and where improvements are needed.
This data is useful for identifying trends, optimizing funnel steps, and making informed business decisions. This article explains how to access the Funnel Analytics Dashboard, understand its layout, and analyze key metrics.
Requirements
Section titled “Requirements”-
An active ClickFunnels account
How to Access The Funnel Analytics Dashboard
Section titled “How to Access The Funnel Analytics Dashboard”You can access detailed performance data for any of your funnels using the Funnel Analytics Dashboard.
Accessing Detailed Analytics from the Funnels Dashboard
Section titled “Accessing Detailed Analytics from the Funnels Dashboard”-
Click on Funnels from the left navigation menu.
-
Locate the funnel from your list and click the Analytics icon to its right.

-
This will take you to the Funnel Analytics Dashboard for the funnel selected.
In the Funnels list, each funnel also shows its all-time Sales total. This figure now includes recurring (subscription) revenue from subscription renewals, not just upfront or one-time sales, so subscription funnels reflect their full lifetime sales.
Viewing Funnel Stats in the Funnel Workflow Builder
Section titled “Viewing Funnel Stats in the Funnel Workflow Builder”In addition to the main dashboard, you can also view performance metrics directly inside the funnel workflow builder for a quick overview. This is useful for quick insights while editing or reviewing your funnel.
-
Open the Funnel Workflow Builder by selecting the funnel from your dashboard.
-
In the Funnel Workflow Builder, you can view performance metrics in three ways:
-
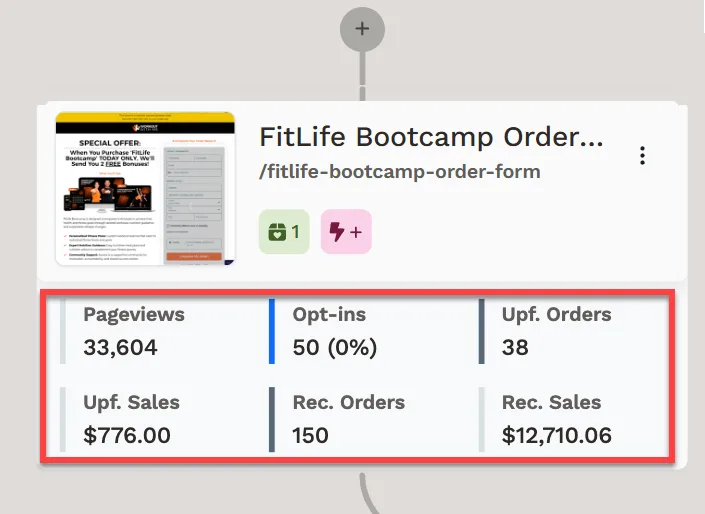
Step-Level Stats: Each funnel step will display its own individual performance metrics directly underneath it (e.g., pageviews, opt-ins, orders, or sales depending on the page type).
-
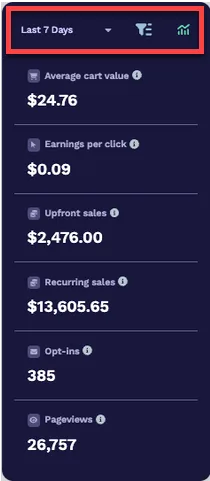
Side Panel Metrics: Click the Analytics button in the top-left corner of the builder to open a side panel. This panel shows overall funnel performance, including:
-
Average cart value: The average revenue generated per unique checkout session (including upsells).
-
Earnings per click: The average amount earned per visitor who clicked into the funnel.
-
Upfront sales: This shows the total amount of upfront sales, one-time products, and only the first invoice of subscription products.
-
Recurring sales: This shows the total amount of sales of recurring products, not considering the upfront (1st invoice).
-
Opt-ins: The number of users who submitted their information on opt-in pages.
-
Pageviews: The total number of times pages in this funnel were viewed.
You can also:
-
Use the date dropdown to filter performance data by timeframe.
-
Click the analytics icon to open the full Funnel Analytics Dashboard in a new tab for deeper insights.
-
-
Full Funnel Analytics Dashboard:
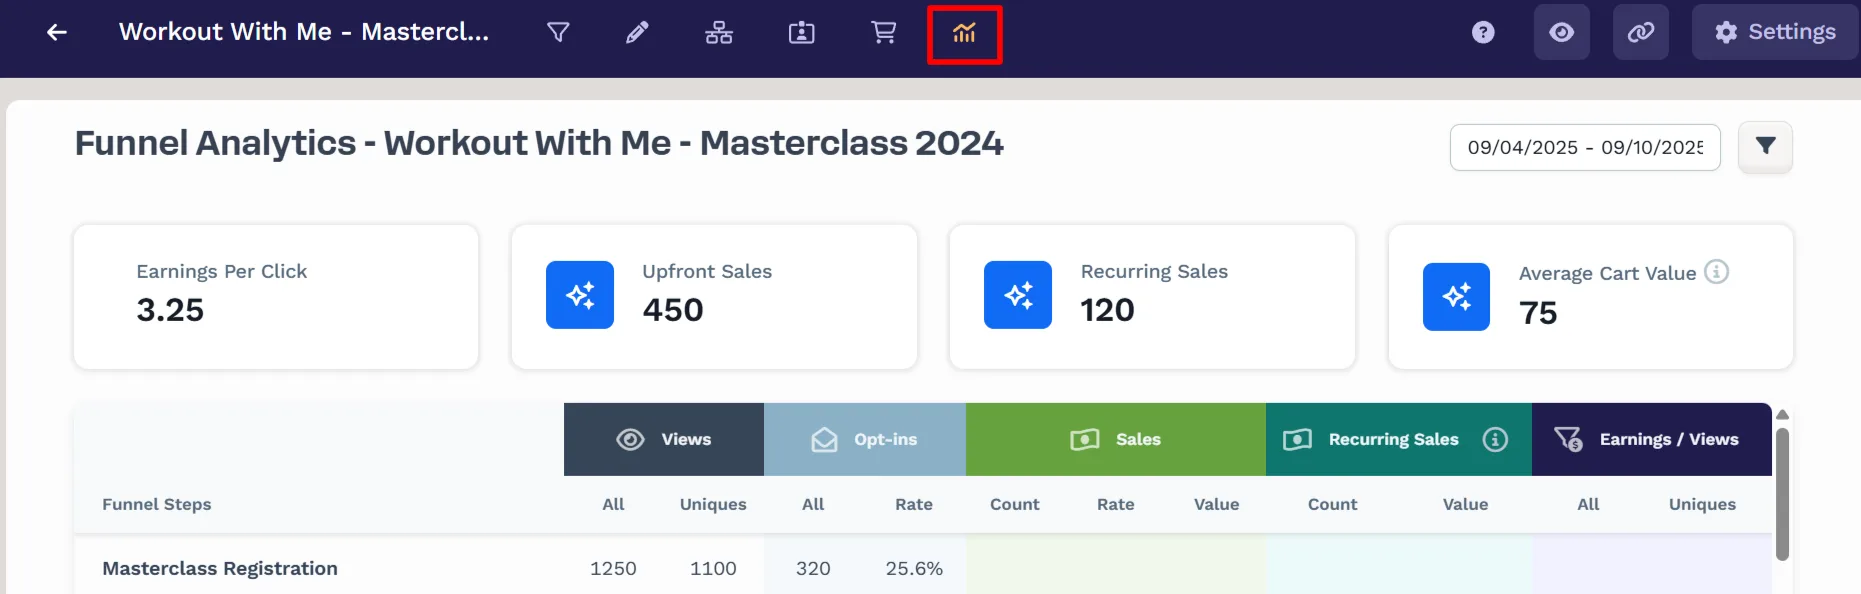
To view detailed performance reports, click the Stats icon in the top navigation bar. This opens the Funnel Analytics Dashboard in a full-page view with filters, timeframes, and advanced breakdowns.
-
Understanding the Dashboard Layout
Section titled “Understanding the Dashboard Layout”The dashboard is divided into sections that help track and analyze funnel performance.
All-Time Sales
Section titled “All-Time Sales”At the top of the Funnel Analytics Dashboard, an all-time sales total is displayed for the funnel. Unlike the date-filtered metrics below it, this figure reflects the funnel’s entire history and includes recurring revenue from subscription products (renewal invoices), in addition to upfront (one-time and first-invoice) sales. This total is calculated in the background and cached, so it may briefly show a calculating state before the value appears.
Date Filter
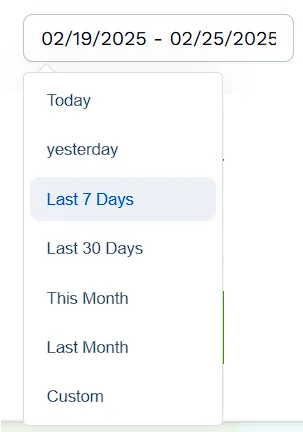
Section titled “Date Filter”The Date Filter drop-down menu is at the top-right corner of your page. It filters the dashboard results by date. You can select from the predefined options or apply a custom time frame. Predefined options include ranges such as Year to Date and All Time, which let you view a funnel’s full-history performance.
UTM Filter
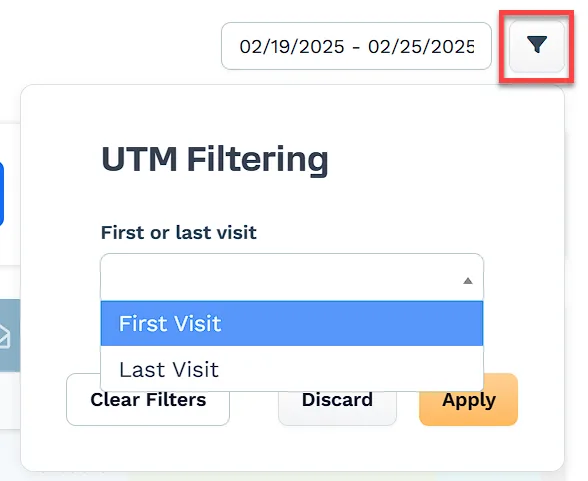
Section titled “UTM Filter”Allows filtering results based on First or Last visit, making it easier to track campaign performance and traffic sources.
Key Metrics Section
Section titled “Key Metrics Section”Displayed at the top of the dashboard, these metrics give a quick snapshot of funnel performance:

-
Earnings Per Click: The average revenue generated per click.
-
Upfront Sales: The total revenue from one-time purchases and trial signups.
-
Recurring Sales: It refers to earnings generated by Subscription products. It includes the second and all later payments of ongoing subscriptions.
-
Average Cart Value: This metric calculates the average amount spent per funnel session. It is determined by dividing the total revenue generated in a funnel by the total number of funnel sessions. This provides insight into how much customers are spending across the funnel.
Breakdown of Key Metrics
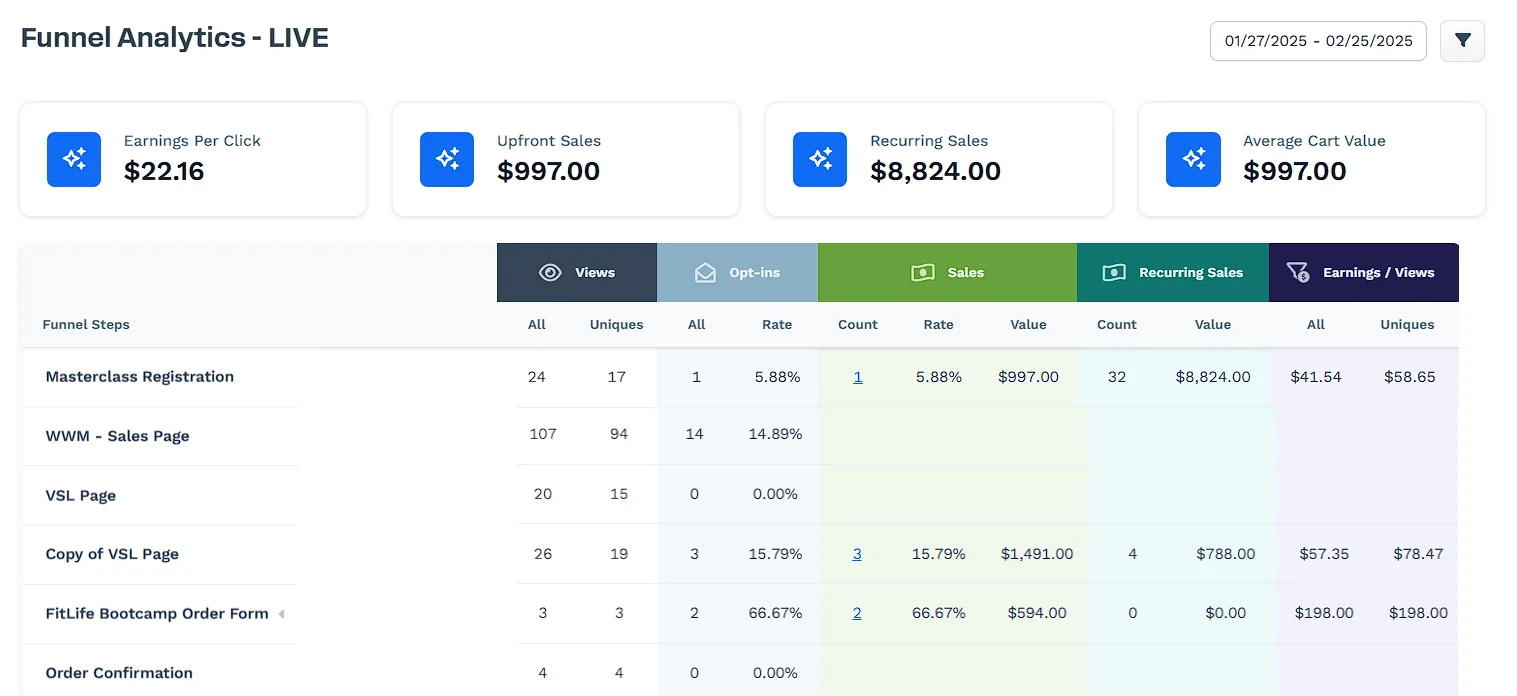
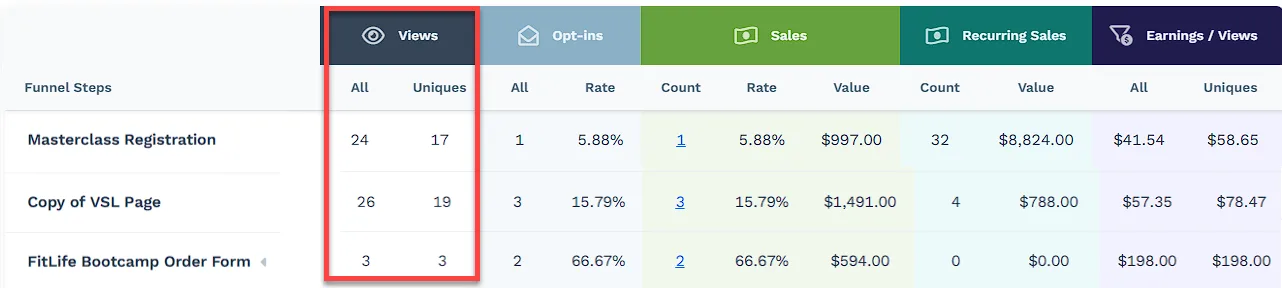
Section titled “Breakdown of Key Metrics”Views: It refers to the Page Views. It is divided into All, which displays all Page Views, and Uniques, which refers to the number of individual sessions during which this page was viewed at least once by a single user.
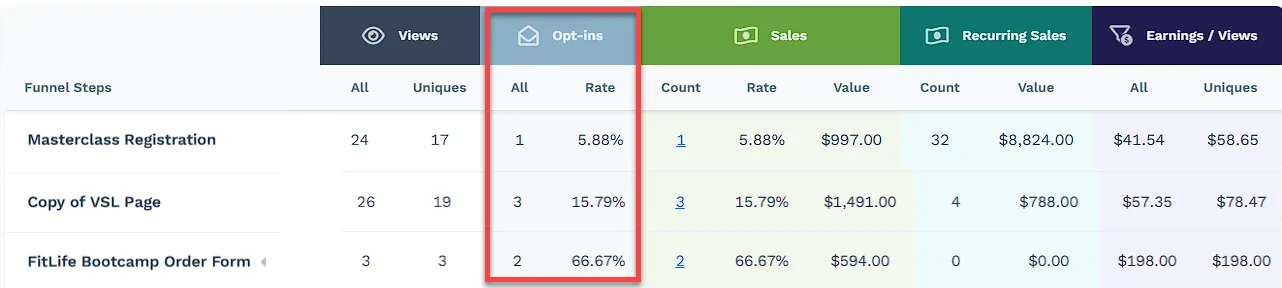
Opt-ins: It refers to the number of opt-ins for every funnel step and its conversion rate concerning Page Views.
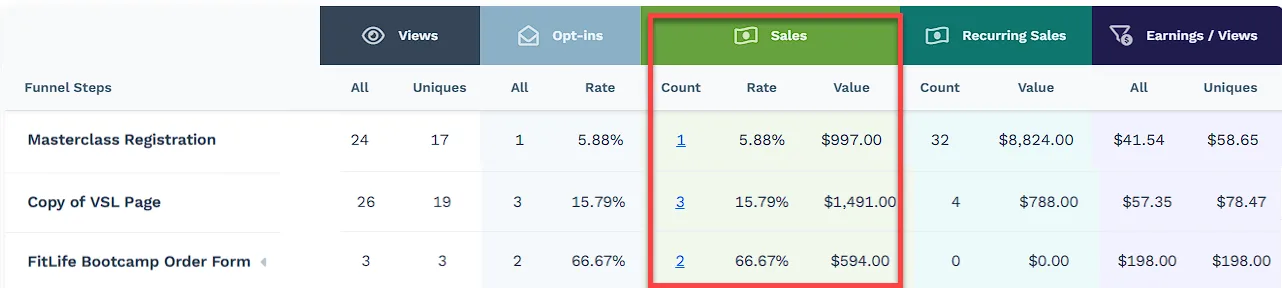
Sales: It refers to the completed purchases at a specific funnel step. The Count reflects the total number of completed sales and provides a quick snapshot of overall performance. By clicking on the Count, users can drill down into the specific orders that contribute to this number, which will take them to the orders page with relevant filters applied. This allows them to see exactly which transactions were completed, analyze customer behavior, and identify trends. By reviewing these orders, users can pinpoint which funnel steps lead to the most conversions, identify potential drop-off points, and assess which products or offers resonate best with customers.
The Rate shows the percentage of visitors who made a purchase, while the Value represents the total revenue generated. Together, these metrics help users understand conversion performance and revenue impact at each funnel step.
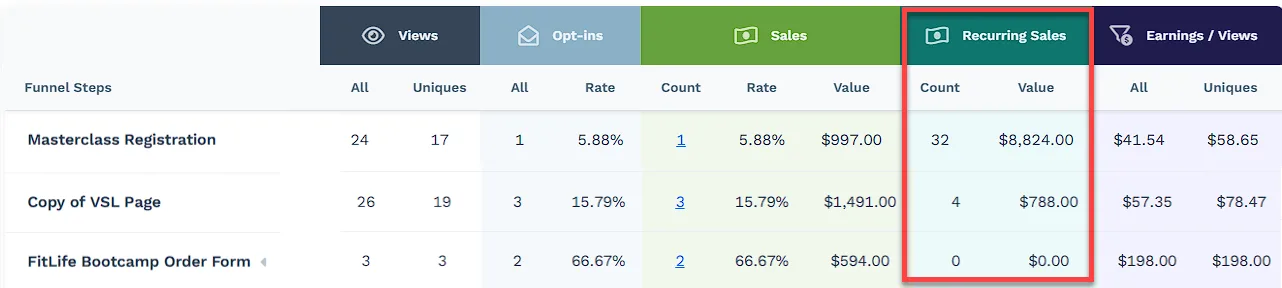
Recurring Sales: It refers to the payments from subscription-based products. The Count displays the number of successful recurring payments, while the Value represents the total revenue earned from those payments. This metric is particularly useful for businesses that rely on memberships or subscription models.
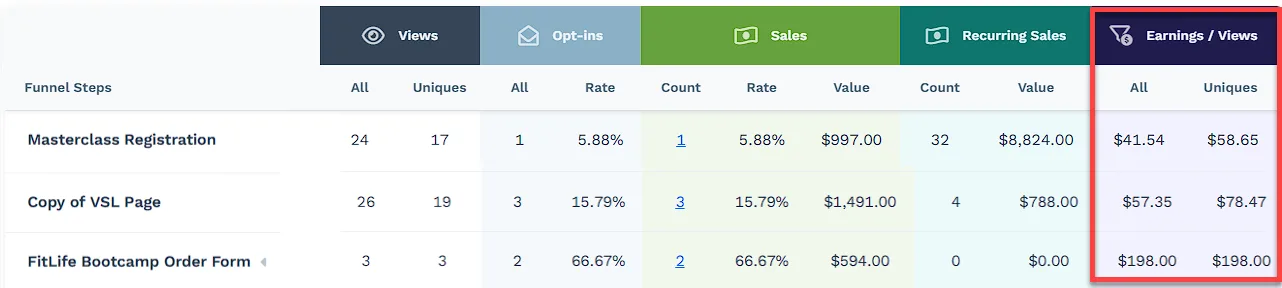
Earnings/Views: It calculates how much revenue is generated per visitor. It is divided into All Earnings per View, which accounts for total page views, and Uniques Earnings per View, which is based only on distinct visitors. A high earnings-per-view value indicates that a page is performing well in terms of revenue generation.
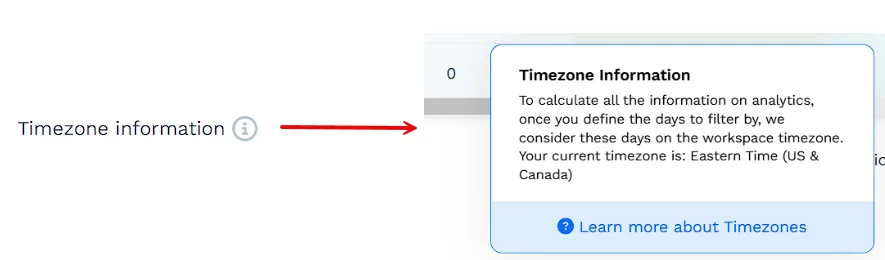
Timezone information: It is an informational section that states the current workspace timezone, which is the one used for the Date Filter and results.
Viewing Orders from a Funnel Step
Section titled “Viewing Orders from a Funnel Step”In addition to analytics, you can also view order details directly from a funnel step.
-
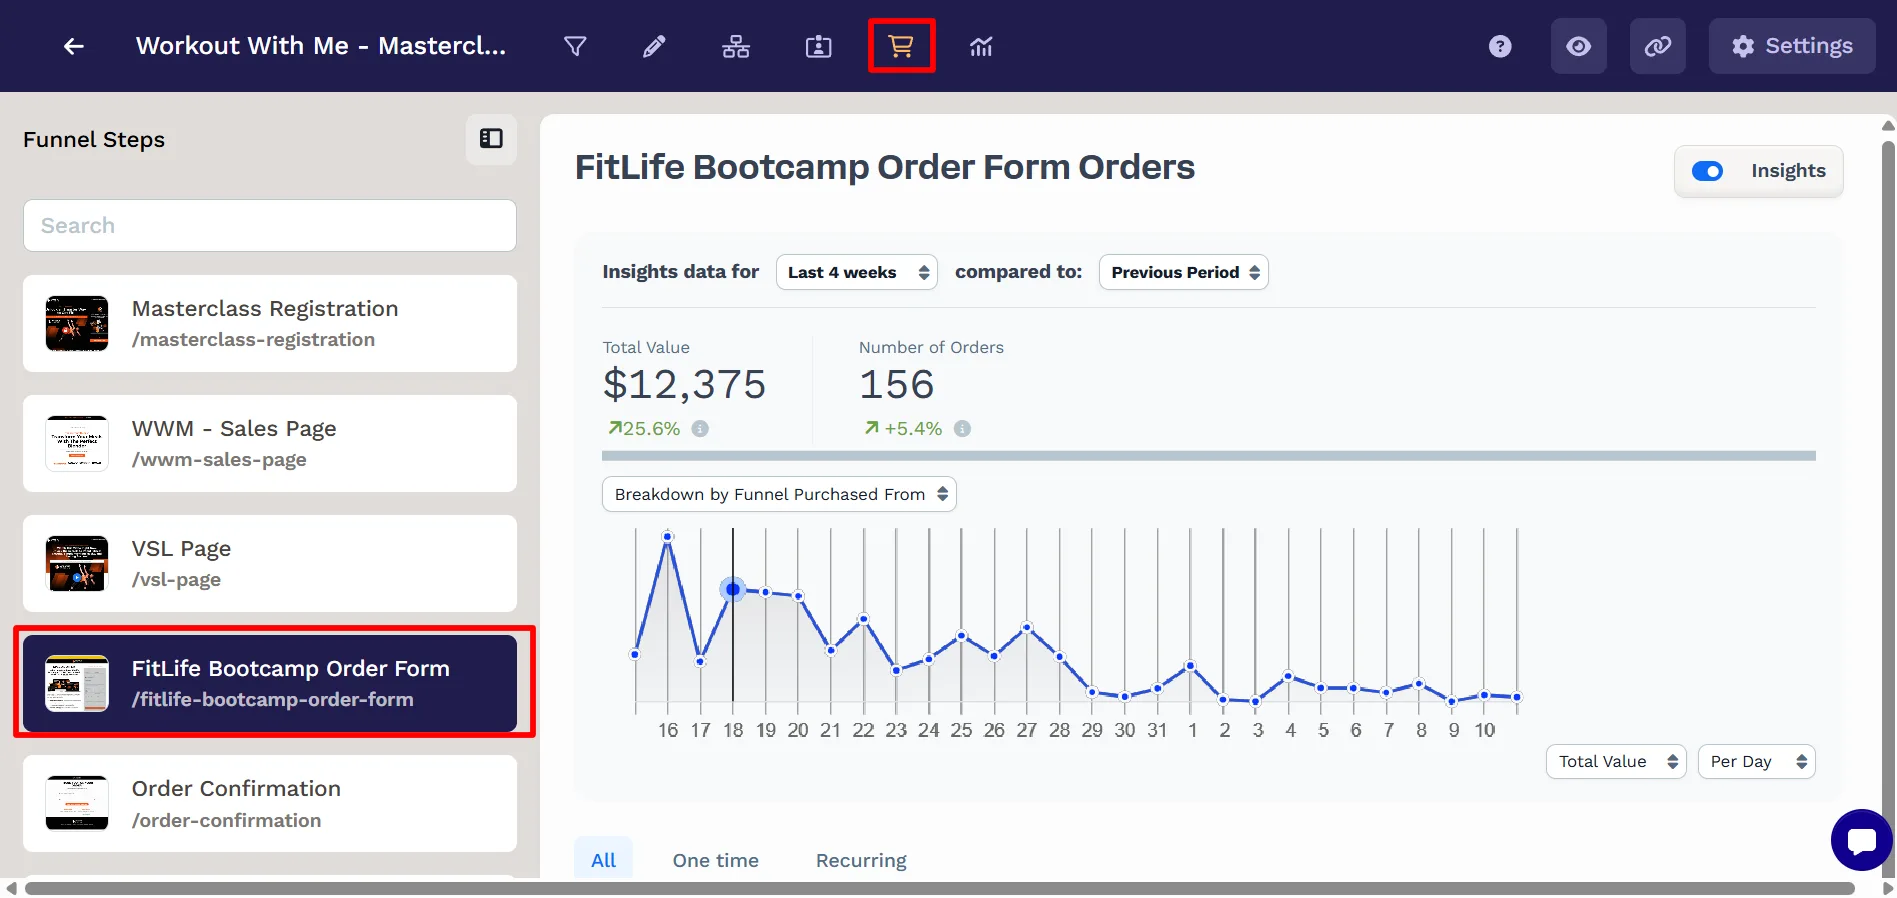
In the Funnel Workflow Builder, click the Orders icon (shopping cart) at the top of the page.
-
This opens the Orders view for the selected funnel, showing:
-
Total Value of collected payments
-
Number of Orders
-
Breakdown by date (graph)
-
Order list, including order number, customer, items, order status, fulfillment status, billing status, and total collected.
-
-
Use the filters (All, One-time, Recurring) to adjust the order list.
-
To explore orders tied to a different funnel step, simply click on another step in the left-hand funnel navigation. The orders panel will refresh to show results specific to that step.